Tips from Warren Buffett
1. Invest in Businesses, not in stocks
2. Stick to businesses you understand
3. Buy companies with defensible “franchises” or “moats”
4. Hold for the long term
5. Ignore short-term fluctuations in price
6. Buy good businesses when prices are down or at rational prices
7. Be a passive investor, not an active trader
8. Do not over-diversify
9. Invest only when there is a Margin of Safety
10. Ignore macroeconomic events
11. Intelligent investing is one with both growth and value
Sunday, October 12, 2008
Friday, August 8, 2008
Contrarian Investing By Anthony M. Gallela & William Patalon III
The Buy Rules
* Price/Free Cash FLow (P/FCF) < 10
* Price/Book (P/B) < 1
* Price/Sales (P/S) < 1
The Sell Rules
The Risk Diversification RuleOut of the 100% Portfolio:
 is available at Amazon.
- Initial Trigger: "Down-By-Half Rule"
- Confirming Indicators:
- Major stock purchases by insider or knowledgable outsiders
- Must meet at least 2 of the following 4 fundamental analysis indicators
* Price/Free Cash FLow (P/FCF) < 10
* Price/Book (P/B) < 1
* Price/Sales (P/S) < 1
- Additional minor rules:
- Stock must be at least $5 per share (US market)
- Companies with large market capitalization > $150 million (US market)
- Change of top management in a company with problems is a positive sign
- "One-timers". Stock which have strong fundamentals but is beaten down by a one-time event (such as accident or adjustment for obsolete inventory)
The Sell Rules
- Put in a 25% "Stop Loss" Order
- Sell after a 50% Gain or 3 Yrs whichever is earlier
- Exception to the 50% Rule if the upside is clear. Move Stop Loss to 30% Gain Mark
The Risk Diversification RuleOut of the 100% Portfolio:
- 5% Purchase for each stock
- 20% holding for each Industry
Saturday, June 28, 2008
ST Engineering

Chart obtained with ChartNexus.
This ticker is downtrending but if you want to do short term trading. Hop On!
The RSI is at 2%, Williams is at -91.
Price bar is dipped below the Bollinger Band Support. Backed by High Volume.
Reached its 2 yr low.
Take some risk and gain some profits. Hopefully I am right.
- Wearing a TRADING hat -
Wednesday, April 2, 2008
Higher savings rate with Poems MMF
[Disclaimer: The author does not achieve any monetary gains from posting this entry.]
For those who doesn't know what POEMS is, it is a trading account. MMF is a facility to temporarily park money during stock trading. When money is put into POEMS account, it will be automatically bought into MMF at the price stated on that day. When stock trade is done, the MMF unit will be sold at the price stated on that day to pay for the trade.
One and a half month ago, I activated my POEMS MMF (Money Market Fund) account. Since then, I started tracking the MMF price. I have also gotten historical pricing from "Bully The Bear".
Below is the data I have gathered from POEMS as well as "Bully The Bear".
If the calculation is based on the first date and the last date, the interest rate is slightly lower.
[Note: Hopefully my calculation is correct]
I am fully aware that there are many other "rainy day savings haven"; to name a few would be Citibank Step-Up Account(currently stepping up to 1.2%pa) and StandardChartered eSaver Account. Well, I suppose I prefer POEMS MMF to others because I can gain better access to the money.
For those who doesn't know what POEMS is, it is a trading account. MMF is a facility to temporarily park money during stock trading. When money is put into POEMS account, it will be automatically bought into MMF at the price stated on that day. When stock trade is done, the MMF unit will be sold at the price stated on that day to pay for the trade.
One and a half month ago, I activated my POEMS MMF (Money Market Fund) account. Since then, I started tracking the MMF price. I have also gotten historical pricing from "Bully The Bear".
Below is the data I have gathered from POEMS as well as "Bully The Bear".
| Date | Price | interest rate compared to previous record (%pa) |
| 02/05/2007 | 1.0908 | |
| 04/05/2007 | 1.0909 | 1.67 |
| 08/05/2007 | 1.0910 | 0.84 |
| 09/05/2007 | 1.0912 | 6.69 |
| 10/05/2007 | 1.0913 | 3.34 |
| 14/05/2007 | 1.0914 | 0.84 |
| 15/05/2007 | 1.0916 | 6.69 |
| 16/05/2007 | 1.0917 | 3.34 |
| 17/05/2007 | 1.0918 | 3.34 |
| 21/05/2007 | 1.0919 | 0.84 |
| 23/05/2007 | 1.0921 | 3.34 |
| 24/05/2007 | 1.0922 | 3.34 |
| 28/05/2007 | 1.0923 | 0.84 |
| 29/05/2007 | 1.0925 | 6.68 |
| 01/06/2007 | 1.0926 | 1.11 |
| 05/06/2007 | 1.0927 | 0.84 |
| 06/06/2007 | 1.0930 | 10.02 |
| 08/06/2007 | 1.0931 | 1.67 |
| 12/06/2007 | 1.0933 | 1.67 |
| 13/06/2007 | 1.0934 | 3.34 |
| 18/06/2007 | 1.0935 | 0.67 |
| 19/06/2007 | 1.0938 | 10.01 |
| 21/06/2007 | 1.0939 | 1.67 |
| 25/06/2007 | 1.0940 | 0.83 |
| 26/06/2007 | 1.0942 | 6.67 |
| 28/06/2007 | 1.0943 | 1.67 |
| 29/06/2007 | 1.0944 | 3.34 |
| 03/07/2007 | 1.0946 | 1.67 |
| 04/07/2007 | 1.0947 | 3.33 |
| 06/07/2007 | 1.0948 | 1.67 |
| 10/07/2007 | 1.0951 | 2.50 |
| 12/07/2007 | 1.0952 | 1.67 |
| 13/07/2007 | 1.0953 | 3.33 |
| 17/07/2007 | 1.0955 | 1.67 |
| 19/07/2007 | 1.0956 | 1.67 |
| 20/07/2007 | 1.0957 | 3.33 |
| 24/07/2007 | 1.0959 | 1.67 |
| 25/07/2007 | 1.0960 | 3.33 |
| 27/07/2007 | 1.0961 | 1.67 |
| 30/07/2007 | 1.0962 | 1.11 |
| 31/07/2007 | 1.0963 | 3.33 |
| 01/08/2007 | 1.0964 | 3.33 |
| 02/08/2007 | 1.0965 | 3.33 |
| 06/08/2007 | 1.0967 | 1.66 |
| 07/08/2007 | 1.0968 | 3.33 |
| 08/08/2007 | 1.0969 | 3.33 |
| 10/08/2007 | 1.0970 | 1.66 |
| 13/08/2007 | 1.0971 | 1.11 |
| 15/08/2007 | 1.0974 | 4.99 |
| 16/08/2007 | 1.0975 | 3.33 |
| 20/08/2007 | 1.0976 | 0.83 |
| 21/08/2007 | 1.0978 | 6.65 |
| 22/08/2007 | 1.0979 | 3.32 |
| 24/08/2007 | 1.0980 | 1.66 |
| 28/08/2007 | 1.0982 | 1.66 |
| 29/08/2007 | 1.0983 | 3.32 |
| 30/08/2007 | 1.0984 | 3.32 |
| 03/09/2007 | 1.0985 | 0.83 |
| 04/09/2007 | 1.0987 | 6.65 |
| 07/09/2007 | 1.0988 | 1.11 |
| 10/09/2007 | 1.0989 | 1.11 |
| 11/09/2007 | 1.0991 | 6.64 |
| 13/09/2007 | 1.0992 | 1.66 |
| 14/09/2007 | 1.0993 | 3.32 |
| 18/09/2007 | 1.0995 | 1.66 |
| 20/09/2007 | 1.0996 | 1.66 |
| 21/09/2007 | 1.0997 | 3.32 |
| 22/09/2007 | 1.0999 | 6.64 |
| 26/09/2007 | 1.1000 | 0.83 |
| 28/09/2007 | 1.1001 | 1.66 |
| 06/10/2007 | 1.1005 | 1.66 |
| 12/10/2007 | 1.1009 | 2.21 |
| 16/10/2007 | 1.1011 | 1.66 |
| 17/10/2007 | 1.1012 | 3.31 |
| 19/10/2007 | 1.1013 | 1.66 |
| 23/10/2007 | 1.1015 | 1.66 |
| 24/10/2007 | 1.1016 | 3.31 |
| 26/10/2007 | 1.1017 | 1.66 |
| 30/10/2007 | 1.1019 | 1.66 |
| 31/10/2007 | 1.1020 | 3.31 |
| 02/11/2007 | 1.1021 | 1.66 |
| 06/11/2007 | 1.1023 | 1.66 |
| 07/11/2007 | 1.1024 | 3.31 |
| 13/11/2007 | 1.1027 | 1.66 |
| 14/11/2007 | 1.1028 | 3.31 |
| 16/11/2007 | 1.1029 | 1.65 |
| 19/11/2007 | 1.1030 | 1.10 |
| 20/11/2007 | 1.1031 | 3.31 |
| 21/11/2007 | 1.1032 | 3.31 |
| 22/11/2007 | 1.1033 | 3.31 |
| 26/11/2007 | 1.1034 | 0.83 |
| 27/11/2007 | 1.1036 | 6.62 |
| 29/11/2007 | 1.1037 | 1.65 |
| 03/12/2007 | 1.1038 | 0.83 |
| 04/12/2007 | 1.1039 | 3.31 |
| 05/12/2007 | 1.1040 | 3.31 |
| 07/12/2007 | 1.1041 | 1.65 |
| 11/12/2007 | 1.1042 | 0.83 |
| 12/12/2007 | 1.1044 | 6.61 |
| 14/12/2007 | 1.1045 | 1.65 |
| 17/12/2007 | 1.1046 | 1.10 |
| 20/12/2007 | 1.1048 | 2.20 |
| 21/12/2007 | 1.1049 | 3.30 |
| 24/12/2007 | 1.1050 | 1.10 |
| 26/12/2007 | 1.1052 | 3.30 |
| 27/12/2007 | 1.1053 | 3.30 |
| 28/12/2007 | 1.1054 | 3.30 |
| 02/01/2008 | 1.1056 | 1.32 |
| 29/02/2008 | 1.1092 | 2.05 |
| 05/03/2008 | 1.1094 | 1.32 |
| 08/03/2008 | 1.1095 | 1.10 |
| 11/03/2008 | 1.1096 | 1.10 |
| 12/03/2008 | 1.1097 | 3.29 |
| 14/03/2008 | 1.1098 | 1.64 |
| 17/03/2008 | 1.1100 | 2.19 |
| 25/03/2008 | 1.1101 | 0.41 |
| 26/03/2008 | 1.1103 | 6.58 |
| Average Interest rate (%pa) >>>> | 2.70% |
If the calculation is based on the first date and the last date, the interest rate is slightly lower.
| Date | Price | interest rate (%pa) |
| 02/05/2007 | 1.0908 | |
| 26/03/2008 | 1.1103 | 1.98 |
[Note: Hopefully my calculation is correct]
I am fully aware that there are many other "rainy day savings haven"; to name a few would be Citibank Step-Up Account(currently stepping up to 1.2%pa) and StandardChartered eSaver Account. Well, I suppose I prefer POEMS MMF to others because I can gain better access to the money.
Monday, March 24, 2008
SPC - Singapore Petroleum Company
This stock may not be an STI component but it is indeed very attractive. It has times and again defied gravity. When many blue chips aren't doing so well, SPC as a defensive stocks does not falter much. It fluctuates a little and moves in a slow staggering manner. But, above all, it has such a great dividend payout.
Let's take a peek at how healthy SPC is via its FA(Source taken from DBS Vickers):

DBS Vickers shows that SPC has 9.202%pa of dividend yield. Isn't it wonderful?
Let's move on to see some chartings for a TA. (Source taken from ChartNexus)

As for SPC, i won't have to depend on RA at all... I am so gonna buy SPC and hold for Super Duper Long Term. It's HUGE Dividend is good enough for a source of other investment income. There are many average stocks, many good stocks BUT SPC is certainly one of the BEST!
[PS: SPC Ex-Date for 40cents final dividend is on 24th April 08. Payout date is on 12th May 08. So, go do your Maths and Risk Analysis]
Friday, January 25, 2008
The Palm Oil World, featuring Wilmar International (Elite #28)
Months ago, I looked at the huge increase in oil price. I heard of the frequent climate change in the news. I heard of the news about bio-diesel as one of the greener replacement of crude oil. The main component of bio-diesel is either corn, soybeans or crude PALM OIL.
Here are the following palm oil related stocks listed in SGX board:
So, let me start with the FA(Financial Analysis) for Wilmar. (Source taken from DBS Vickers)
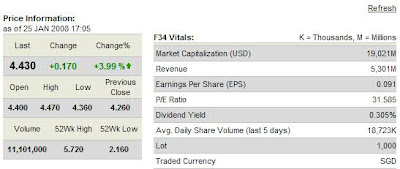
Now, for its TA(Technical Analysis). (Source taken from ChartNexus)
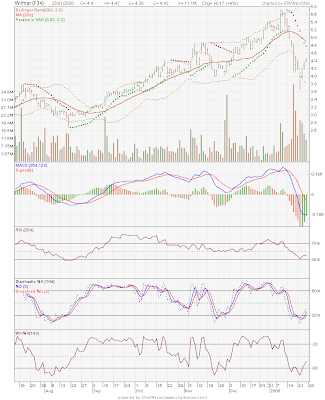
If you cant see the diagram, too bad!! ;-p. You may get them from their actual source.
As for now, the RA (Rumor Analysis), I shall not make any commendation except that this seems like a very healthy company.
Here are the following palm oil related stocks listed in SGX board:
- Wilmar International Limited
- Golden Agri-Resources Ltd (GARS)
- Indofood Agri Resources Ltd
- First Resources Ltd
So, let me start with the FA(Financial Analysis) for Wilmar. (Source taken from DBS Vickers)

Now, for its TA(Technical Analysis). (Source taken from ChartNexus)

If you cant see the diagram, too bad!! ;-p. You may get them from their actual source.
As for now, the RA (Rumor Analysis), I shall not make any commendation except that this seems like a very healthy company.
STI's Elite 30
Based on Today's Article dated Wed, Jan 9th 2008, the elite 30 of SGX-listed blue chips are as follows:
- CapitaLand
- CapitaMall Trust
- City Developments
- Cosco Corp(S)
- DBS Group Holdings
- Fraser And Neave
- Genting International
- Hong Kong Land
- Jardine Cycle and Carriage
- Jardine Strategic
- Keppel Corp
- Keppel Land
- Neptune Oriental Lines
- Noble Group
- Olam International
- OCBC Bank
- SembCorp Ind
- SembCorp Marine
- SIA Engineering
- Singapore Airlines
- Singapore Exchange
- Singapore Press Holdings
- ST Engineering
- S'pore Telecom
- Starhub
- Thai Beverage
- United Overseas Bank
- Wilmar International
- Yangzijiang Shipbuilding Holdings
- Yanlord Land Group
Subscribe to:
Posts (Atom)